Watch all the Transform 2020 sessions on-demand here.
Cruise, the self-driving startup that General Motors acquired for nearly $1 billion in 2016, generates an enormous amount of data by any measure. It orchestrates 200,000 hours of driving simulation jobs daily in Google Cloud Platform, spread across 30,000 virtual cars in an environment running on 300,000 processor cores and 5,000 graphics cards. Both those cars and Cruise’s fleet of over 180 real-world autonomous Chevrolet Bolts make thousands of decisions every second, and they base these decisions on observations captured in binary format from cameras, microphones, radar sensors, and lidar sensors.
Insights gleaned from the resulting petabytes of data inform improvements to Cruise’s software and hardware stacks, in part with the help of an internal visualization tool — Webviz — that’s now used by nearly a thousand monthly active Cruise engineers spanning dozens of teams. Today, in the spirit of open collaboration, Cruise announced that it’ll make Webviz freely available to developers in need of a modular robotics analysis solution.
“In the early days of Cruise, engineers who wanted to visualize AV data used a suite of tools … While these tools were powerful, using them required installing a full development environment on a specific platform, and manually positioning windows running separate tools on the screen,” explained Cruise software engineer Esther Weon in a Medium post. “Webviz is now one of the most widely used data analysis tools at Cruise.”
June 5th: The AI Audit in NYC
Join us next week in NYC to engage with top executive leaders, delving into strategies for auditing AI models to ensure fairness, optimal performance, and ethical compliance across diverse organizations. Secure your attendance for this exclusive invite-only event.
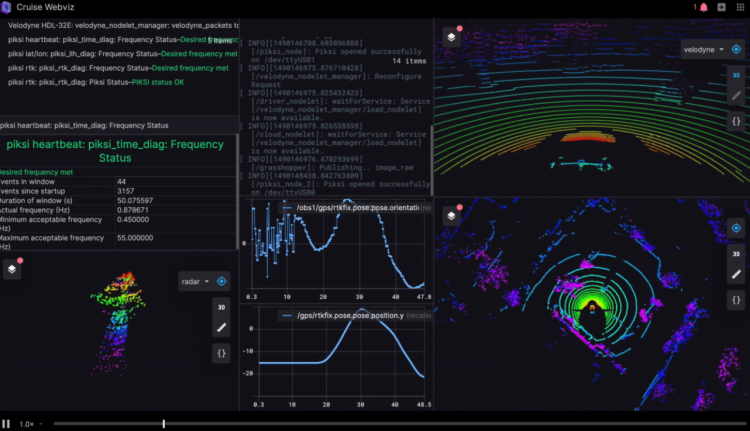
The web-based Webviz — which takes as input any bag file (the message format used by the popular Robot Operating System, or ROS for short) and outputs charts and graphs — has its roots in a Cruise hackathon project. A group of engineers combined open source plugins like rviz (which displays 3D data), rqt_console (which filters ROS messages), rqt_runtime_monitor (which reads diagnostics array messages), and rqt_plot (which plots numeric values in 2D) into Webviz, which eventually gained a dedicated development team.
In time, this team developed custom panels to serve Cruise-specific needs, which became more finely tuned as Webviz moved away from its legacy foundations. The latest production version enables users to save configurations and share among teammates the parameters needed for workflows, and to tap into Cruise’s other internal tools to watch simulations as they run or stream historical data directly from a data lake.
The open source release of Webviz isn’t quite as robust, but it contains a collection of general panels applicable to most robotics developers, according to Weon. New panels are already in the works, and Cruise intends to release a public API that’ll allow developers to build custom panels themselves.

“By streamlining the process by which we understand how our AVs see the world, interpret data, and make decisions on the road, Webviz has accelerated progress towards our mission — building the world’s most advanced self-driving vehicles to safely connect people with the places, things and experiences they care about,” Weon wrote. “Through it all, our guiding philosophy has been to provide users with a flexible set of tools that they can configure, extend, and customize for a variety of unique workflows.”
Webviz’s public launch comes after Cruise’s open-sourcing of Worldview, a graphics stack of 2D and 3D scenes with accompanying mouse and movement controls, click interaction, and a suite of built-in commands, and that came shortly after Uber open-sourced a web-based platform for vehicle data dubbed Autonomous Visualization System (AVS). Cruise’s and Uber’s contributions advance something of an open source trend in the autonomous vehicles industry — last year, Beijing, China-based tech giant Baidu and the University of California at Berkeley released large-scale self-driving corpora Apollo Scape and BDD100K, respectively, and startup NuTonomy in September debuted a self-driving data set — nuScenes — that it claimed at the time was the “largest open-source, multi-sensor self-driving dataset available to public.”
Separately this week at the IEEE Conference on Computer Vision and Pattern Recognition (CVPR) 2019 in Long Beach, California, Google parent company Alphabet’s Waymo released a new high-quality multimodal sensor data set for autonomous driving, featuring some 3,000 driving scenes totalling 16.7 hours of video data, 600,000 frames, and approximately 25 million 3D bounding boxes and 22 million 2D bounding boxes. Other similar collections include Mapillary’s Vistas data set of street-level imagery, the KITTI collection for mobile robotics and autonomous driving research, and the Cityscapes data set developed and maintained by Daimler, the Max Planck Institute for Informatics, and the TU Darmstadt Visual Inference Group.