
As the various platforms battle for video streaming supremacy, their rivalry has ignited a rapid expansion in the amount of content available to consumers.
According to the Total Audience Report released today by Nielsen, as of December 2019, U.S. consumers could choose from 646,152 unique program titles available on traditional linear and streaming services. That’s an increase of 10% from 2018, according to Nielsen.
That explosion of viewing choices is just one of many ways the streaming wars are reshaping viewing habits.
“The proliferation of on-demand streaming services is the most profound media disruption of the last half-century,” wrote Peter Katsingris, Nielsen’s senior vice president of Audience Insights, in an introduction to the report. “And this disruption is driving profound, real, actionable opportunity across all facets of the industry.”
June 5th: The AI Audit in NYC
Join us next week in NYC to engage with top executive leaders, delving into strategies for auditing AI models to ensure fairness, optimal performance, and ethical compliance across diverse organizations. Secure your attendance for this exclusive invite-only event.
While Netflix, Amazon Prime, and Hulu have been offering subscription video streaming services for more than a decade, a host of major players have joined the scrum in the past year. Activity includes Apple’s launch of Apple TV+ and the introduction of Disney+. And new entrants will soon include HBO Max, the short-form streaming service Quibi, and Peacock from NBCUniversal.
Rather than picking and choosing, consumers are opening their wallets wide and begging companies to take their money. Nielsen’s report projects that while consumers spent about $600 million on video and audio content in 2019, that number is projected to grow to $1 trillion by 2023.
This growth is possible because video streaming still accounts for a fraction of the time spent viewing content, around 19% for households that have some ability to view such services via a smart TV or computer, according to Nielsen.
In the U.S., Nielsen found that 73% of households now have some kind of video streaming subscription service, and about 33% have three or more streaming services.
Amid a frenzy that encompasses both audio and video streaming content, consumers are simply spending more time glued to their screens.
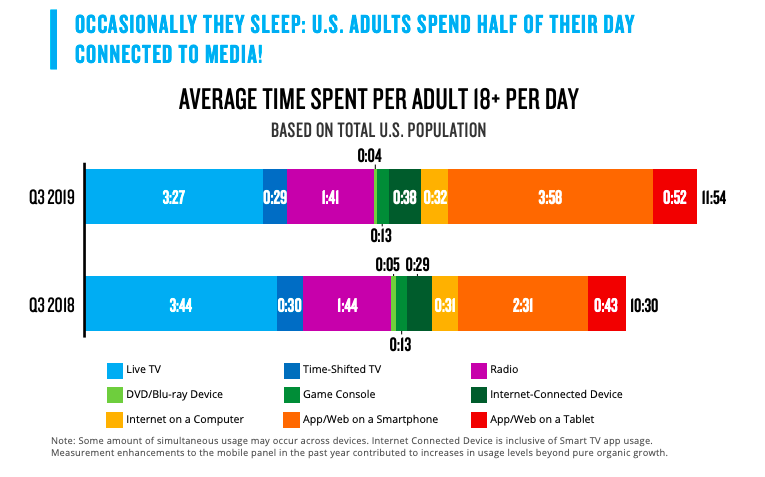
According to Nielsen, the average consumer now spends an entire extra day each week watching or listening to some form of digital media content, compared to six years ago. In Q3 2019, we spent 11 hours and 54 minutes each day interacting with our gadgets, including TV, TV-connected devices, radio, computers, smartphones, and tablets. That represents an increase of 1 hour and 24 minutes from Q3 2018.
Content makers and advertisers are salivating.
“That is a great amount of the waking day for consumer connectivity, so this amount of time is especially eye-opening,” the report notes. “Marketers and content creators have literally every waking hour of a consumers’ day to put forth their best messages.”
